Novomatic and EGT gain share as Pragmatic Play’s global content lead narrows in August
Pragmatic Play and Evolution Gaming retained the two leading positions across global operator game portfolios in August 2026, but the gap narrowed as Novomatic, EGT and Jili Games strengthened their share of monitored content.
The global distribution of casino content remained highly stable at the top of the supplier rankings between July and August 2026, with the same ten supplier groups occupying the leading ten positions. Beneath that stability, however, several meaningful share movements emerged.
Egamingmonitor.com recorded approximately 212.5 million supplier-group game-tile appearances in August. Changes in supplier share provide a useful indication of relative portfolio visibility.
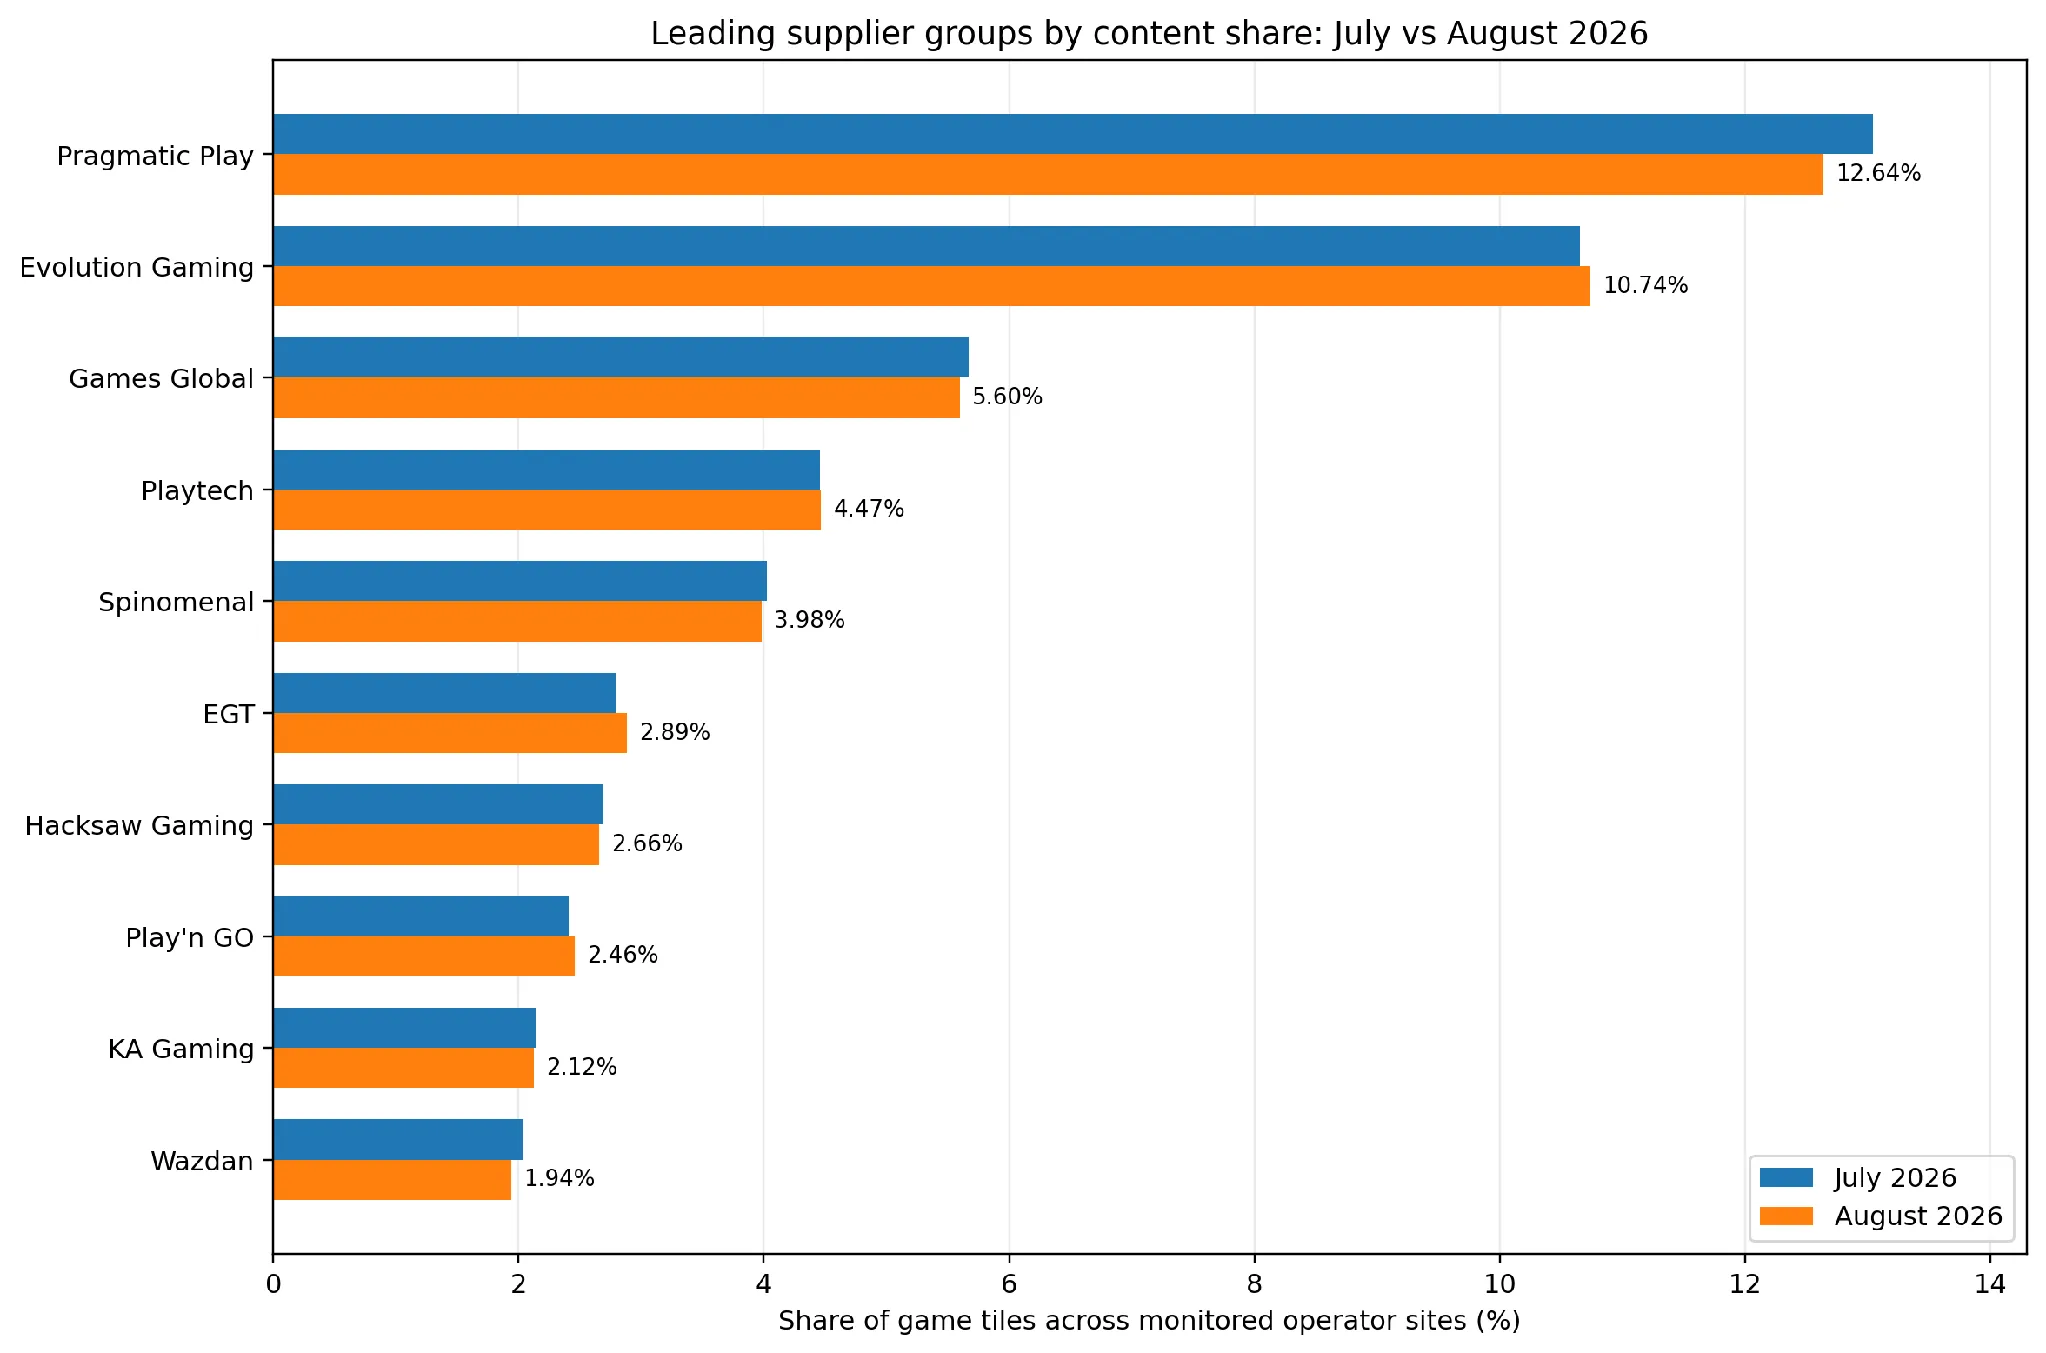
Figure 1. Leading supplier groups by content share, July versus August 2026.
Pragmatic Play remains No.1, but its share falls
Pragmatic Play remained the largest supplier group by a clear margin, accounting for 12.64% of recorded game-tile appearances in August. Its share was down from 13.04% in July, a decline of approximately 0.41 percentage points – the largest share reduction among the leading supplier groups.
Evolution Gaming remained second and moved in the opposite direction. Its share increased from 10.65% to 10.74%, despite a lower absolute number of recorded appearances. The two largest groups together accounted for 23.38% of the August total, compared with 23.70% in July.
Novomatic records the strongest top-20 share gain
Novomatic produced the largest percentage-point increase among the 20 leading supplier groups. Its share rose from 1.48% in July to 1.62% in August, while its recorded game-tile total edged higher from 3.42 million to 3.44 million despite the smaller overall dataset.
The increase lifted Novomatic two places in the ranking, from 14th to 12th. Betsoft Gaming moved in the opposite direction, dropping from 12th to 14th as its share declined from 1.54% to 1.45%.
EGT continues to strengthen in sixth place
EGT remained sixth but increased its share from 2.79% to 2.89%, a gain of approximately 0.10 percentage points. That follows the gains already visible in the earlier May-to-June analysis and reinforces EGT’s position immediately below the five largest supplier groups.
Play’n GO also increased its share, from 2.41% to 2.46%, while Evolution Gaming added around 0.09 percentage points. Wazdan recorded the largest share decline within the top ten after Pragmatic Play, falling from 2.04% to 1.94%.
Jili Games moves into the top 20
Jili Games was another notable riser. Its recorded game-tile total increased slightly from 2.25 million to 2.28 million, while its content share rose from 0.98% to 1.07%. This moved the group from 20th to 18th place.
Endorphina also moved up one position to 16th, while Playson slipped from 19th to 20th and 1X2 Network moved from 16th to 17th. These movements remain relatively small in absolute share terms but illustrate the continuing competition below the leading ten groups.
Key supplier movements
| Supplier group | July share | August share | Change | July rank | August rank |
| Pragmatic Play | 13.04% | 12.64% | -0.41 pp | 1 | 1 |
| Evolution Gaming | 10.65% | 10.74% | +0.09 pp | 2 | 2 |
| EGT | 2.79% | 2.89% | +0.10 pp | 6 | 6 |
| Wazdan | 2.04% | 1.94% | -0.10 pp | 10 | 10 |
| Novomatic | 1.48% | 1.62% | +0.14 pp | 14 | 12 |
| Betsoft Gaming | 1.54% | 1.45% | -0.09 pp | 12 | 14 |
| Jili Games | 0.98% | 1.07% | +0.10 pp | 20 | 18 |
The leading groups still account for roughly half of content
The top ten supplier groups accounted for approximately 49.50% of all recorded game-tile appearances in August, compared with 49.92% in July. The top five represented 37.43%, down from 37.85%.
At the same time, the number of supplier groups identified in the monthly dataset increased from 766 in July to 771 in August. The combination of a slightly lower top-ten share and a larger supplier universe points to a modest broadening of the long tail, even though the leading positions themselves were unchanged. 65 new independent studios have launched already this year, excluding those launched within existing supplier groups.
Portfolio presence, not revenue market share
The figures measure the frequency with which games associated with each supplier group appeared across operator websites monitored by egamingmonitor.com. They should therefore be interpreted as an indicator of content distribution and portfolio visibility, and can be a proxy for revenue market share, especially when other filters are applied such as position on page, size of operator and so forth on the main egamingmonitor data set.
Month-on-month changes can reflect new integrations, game launches, promotional placement, operator portfolio decisions and changes in the volume of pages or game tiles captured during the monitoring period.
Source and methodology: egamingmonitor.com global supplier-group content monitoring data, July and August 2026. The analysis recorded approximately 212.5 million supplier-group game-tile appearances across more than 4,200 operator sites in August. The number of supplier groups identified increased from 766 to 771 (deploying more than 1,000 studio brands). For comprehensive supplier, studio, game and operator-level analysis by market, contact egamingmonitor.com.
FAQs
Who are the leading online casino content suppliers by market share?
Pragmatic Play and Evolution Gaming are among the leading online casino content suppliers by global portfolio presence. eGaming Monitor’s data measures supplier visibility through game-tile appearances across monitored operator websites. In its June 2026 report, Pragmatic Play held the largest share at 13.11%, followed by Evolution Gaming at 10.76%. These figures represent content distribution and portfolio visibility, not direct revenue market share.
Which iGaming suppliers gained the most content share in August 2026?
The August 2026 supplier-share figures should be based on the specific August eGaming Monitor supplier dataset. The available August report confirms that the monitoring dataset covered 4,211 operator sites and recorded more than 212 million game-tile appearances, but it does not provide the supplier-share figures stated in the original answer. Therefore, specific August percentage changes for Novomatic, EGT, or Jili Games should not be presented as fact without the corresponding supplier-share data.
How fragmented is the global iGaming casino content market?
The global iGaming casino content market is highly fragmented, with a large number of studios and supplier groups contributing games across operator websites. eGaming Monitor recorded 65,709 unique games from 1,063 studios in its August 2026 global monitoring dataset. This shows that the market includes both major suppliers and a large long tail of smaller studios.
What is the difference between portfolio presence and iGaming revenue market share?
Portfolio presence measures how frequently games from a supplier appear across monitored online casino websites. It reflects content distribution and visibility rather than direct revenue, player numbers, stakes, or gross gaming revenue (GGR). Changes in portfolio presence can result from new integrations, game launches, operator portfolio decisions, promotional placement, and changes in the monitored websites. Therefore, a higher content share does not automatically mean a supplier has a higher revenue market share.