
EGT and Spinomenal gain ground as supplier content shares shift in June
Pragmatic Play and Evolution Gaming retained commanding positions across operator game portfolios in June 2026, while EGT, Spinomenal and Evoplay recorded some of the strongest month-on-month gains, according to the latest EGM content monitoring data.
The composition of casino content available across operator websites remained broadly stable between May and June 2026, although several supplier groups made noticeable gains within the rankings.
Despite the stable overall total, movement among individual supplier groups shows how operators continue to adjust their game portfolios, promotional placements and supplier mixes.
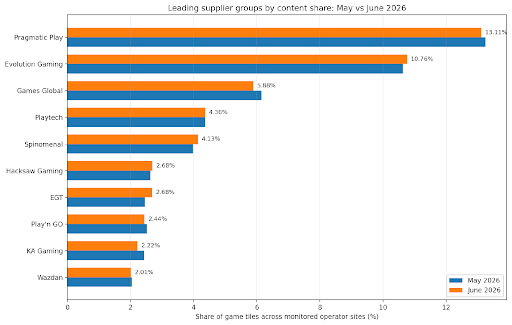
Figure 1. Leading supplier groups by content share, May versus June 2026.
Pragmatic Play remains the clear leader
Pragmatic Play remained the largest supplier group by some distance, accounting for 13.11% of all recorded game tiles in June.
Its total number of appearances decreased from 28.7 million in May to 28.3 million in June, reducing its content share by approximately 0.15 percentage points. Nevertheless, its position at the top of the ranking remained unchallenged.
Evolution Gaming strengthened its second-place position. Its recorded appearances rose from 23.0 million to 23.2 million, increasing its share from approximately 10.63% to 10.76%.
Together, Pragmatic Play and Evolution accounted for almost 24% of all supplier-group game-tile appearances recorded during June.
Games Global remained in third place, although its share declined from approximately 6.15% to 5.88%. Its total game-tile presence fell by 4.6%, from 13.3 million to 12.7 million.
Playtech remained almost unchanged in fourth place, holding a share of approximately 4.36% in both months.
EGT moves above Play’n GO
One of the most notable changes within the leading group was the performance of EGT.
EGT’s recorded game-tile presence increased by 8.6%, from 5.3 million in May to 5.8 million in June. Its share consequently rose from approximately 2.46% to 2.68%, the largest percentage-point gain among the major supplier groups.
This growth allowed EGT to move from eighth to seventh place, overtaking Play’n GO.
Play’n GO’s recorded presence declined by 3.4%, resulting in its share falling from approximately 2.52% to 2.44%.
Spinomenal also continued to expand its presence across operator sites. Its game-tile total increased from 8.6 million to 8.9 million, lifting its share from 3.97% to 4.13%.
The supplier retained fifth position and recorded the second-largest share increase among the ten leading groups.
Hacksaw and Evoplay continue to expand
Hacksaw Gaming remained in sixth place and increased its content share from approximately 2.63% to 2.68%. Its recorded game-tile appearances grew by 1.9% during the month.
Evoplay was another significant riser. Its presence increased by 7.9%, from 2.6 million to 2.8 million appearances, lifting its share from approximately 1.19% to 1.28%.
Other supplier groups recording meaningful gains included Jili Games, whose game-tile presence increased by 9.2%; Fazi, up 7.5%; BetConstruct, up 9.1%; CT Gaming, up 8.6%; and Playson, up 4.4%.
KA Gaming experienced the largest decline among the ten leading supplier groups. Its recorded appearances fell by 8.8%, reducing its content share from approximately 2.43% to 2.22%.
SoftSwiss, Betsoft Gaming, Booming Games, Endorphina and Cherry AB also recorded lower content shares during June.
Leading suppliers still account for half of all content
The overall concentration of casino content among the largest supplier groups changed very little during the month.
The ten leading supplier groups accounted for approximately 50.28% of all recorded game-tile appearances in June, compared with 50.42% in May.
The top five represented 38.24% of the June total, down marginally from 38.36% in May.
This indicates that while the relative positions of individual suppliers continue to evolve, the wider distribution between the largest groups and the long tail of smaller studios remains relatively stable.
Portfolio presence, not revenue market share
The figures measure the frequency with which games associated with each supplier group appeared across the operator websites monitored by EGM.
They should therefore be interpreted as an indicator of content distribution and portfolio visibility, rather than a measurement of revenue, gross gaming yield, player activity or supplier profitability.
Month-on-month changes can reflect a combination of new integrations, game launches, operator portfolio decisions, promotional activity and changes in the websites covered by the monitoring dataset.
Nevertheless, the June results show continued competition beneath the two leading suppliers, with EGT, Spinomenal, Hacksaw Gaming and Evoplay all increasing their relative presence across operator game portfolios.
Source: In June 2026, egamingmonitor.com scanned more than 4,300 operators globally on a daily basis, finding 216 million game tiles for 65,085 unique games from 1076 unique studios belonging to 751 unique supplier groups. Contact egamingmonitor.com for comprehensive access to its unique data by market, by operator, by studio and by game type. Other egamingmonitor.com products include traffic data by market for both operators and affiliates, GGR data by market by vertical and more. Contact us for supplier, studio, game and operator-level analysis by market.